Full Assessment

Membership risks develop years before they appear in your figures.

The Full Assessment analyses the health of your membership across six dimensions. It identifies where risks are developing and where the greatest opportunities lie to build long-term membership value.

What it means for your club

The analysis tells you where you stand. The report tells you what to do about it.

The assessment does more than describe your membership today. It explains what its current structure is likely to mean over the next three to five years, identifies the areas of greatest risk, and highlights where action will have the greatest impact.

For most clubs, the greatest opportunity is not recruiting more members — it is reducing avoidable churn and investing in member development, converting more of the members they already have into long-term established ones.

The report is designed to identify the precise point at which problems are developing — giving clubs the specificity they need to review strategy and build targeted action plans.

What the report answers

Questions every club should be able to answer

Every BirdieIQ assessment is structured around six questions. Most clubs cannot currently answer any of them with confidence. The assessment changes that.

Are we converting new members?

Retention at 12, 24, 36, 48 and 60 months, revealing where in the membership journey attrition concentrates and whether new members are progressing into long-term established membership.

Is our growth genuine?

Whether recruitment is running ahead of attrition, and by how much. Including the replacement ratio trend over three years and the club's reliance on continued recruitment to sustain its numbers.

Is our established base growing or eroding?

Stable membership as a proportion of total membership. The trend shows whether the long-term core of the club is growing, holding or quietly declining — and what the current trajectory implies for the next five years.

Which members are most at risk of leaving?

The proportion of members without a handicap index — one of the strongest leading indicators of future attrition. Identifies where early engagement is breaking down and where action will have the greatest impact.

Is our age profile sustainable?

Age distribution across early-tenure and established membership. Whether younger members are progressing into long-term membership at a rate that supports the club's future demographic balance.

Are we developing female membership?

Female membership recruitment, retention and progression. A thin gender pipeline is one of the most common long-term risks — and one of the most addressable if identified early.

What we measure

Over 80 metrics. Six dimensions. One clear picture.

We track and measure all of this, identify the patterns, and give you the conclusions. Your board gets clear findings they can act on — not a spreadsheet to interpret.

More than 80 individual metrics and calculations · trended over three years
Recruitment & Replacement
  • Total membership — annual and 3-year trend
  • Annual joiners and leavers
  • Net membership change
  • Overall churn rate — 3-year trend
  • Replacement ratio — overall and by membership category
  • Churn rate by membership category
  • Net change by membership category
  • Recruitment vs attrition trend
  • Structural dependency on continued recruitment
New Member Retention
  • Retention at 12, 24, 36, 48 and 60 months
  • Retention at each milestone by age band (5 bands)
  • Retention at each milestone by handicap status
  • Retention at each milestone by gender
  • BirdieIQ Lifecycle Curve
  • Early-tenure exposure % — 3-year trend
  • Member count at each tenure stage
  • Critical drop-off point identification
Handicap Engagement
  • Early-tenure no-handicap % — current snapshot
  • No-handicap share — early-tenure vs established
  • 24-month retention: no-handicap vs other members
  • Retention gap between the two groups
  • Overall handicap participation % — current snapshot
  • Established members without a handicap
  • Handicap registration by tenure stage
  • Handicap registration rate by membership category
Member Stability
  • Established membership % — 3-year trend
  • Average member tenure in years — trend
  • Established, developing and early-tenure member counts
  • Stable vs early-tenure membership mix
  • Early-tenure growth by membership category
  • Stable member threshold analysis
  • 5-year structural trajectory
Demographic Sustainability
  • Average member age — 3-year trend
  • % aged 18–55, under 40, and 70+ — trend
  • % of established members aged 18–55
  • Established base age profile by band
  • Future pipeline age profile — members under 2 years
  • 36-month retention by age band
  • Demographic balance trend
  • Age-weighted churn risk
Gender Pipeline
  • Female membership % — 3-year trend
  • Female average age — trend
  • Female members aged 18–55 and under 55
  • Female joiners and leavers — annual trend
  • Female replacement ratio
  • Age structure by gender
  • Female joiners vs leavers trend
  • Female age profile trend — 3-year
  • Female pipeline gap analysis
  • Gender share of early-tenure base
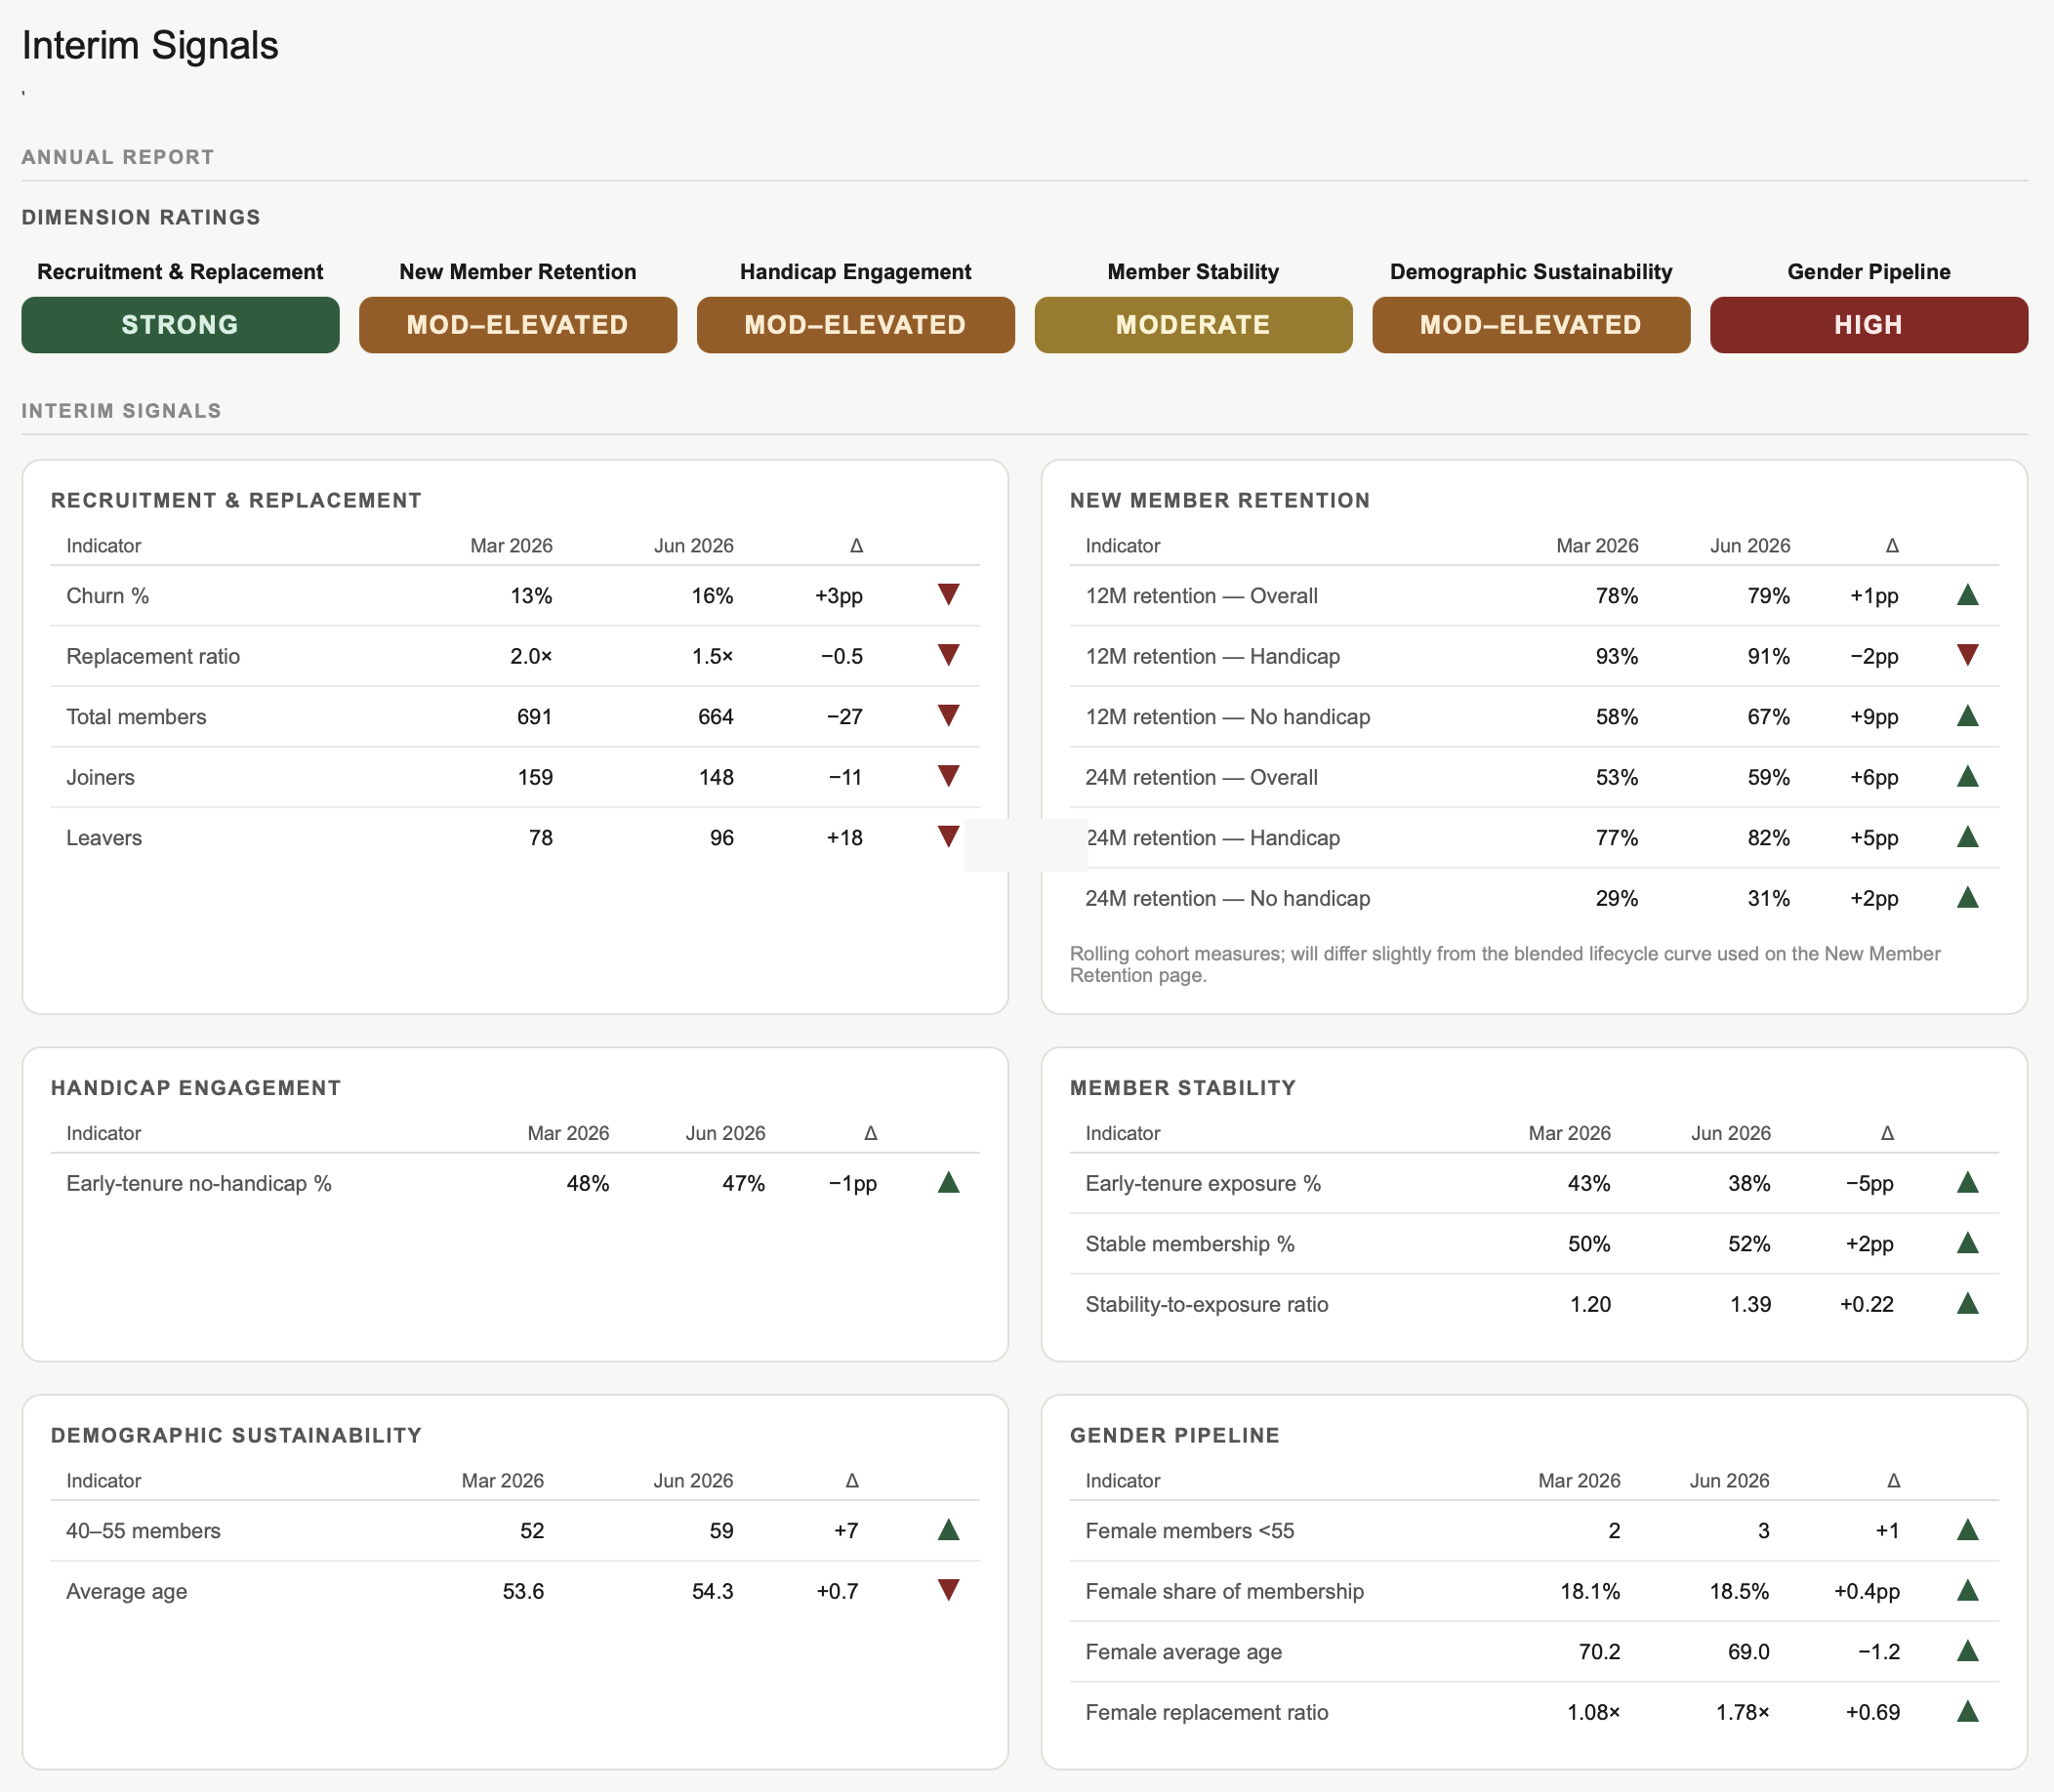
Signals Page — rolling quarter tracking, by dimension

Recruitment & Replacement

  • Total members
  • Joiners
  • Leavers
  • Churn rate
  • Replacement ratio

New Member Retention

  • 12-month retention — overall
  • 12-month retention — handicap
  • 12-month retention — no handicap
  • 24-month retention — overall
  • 24-month retention — handicap
  • 24-month retention — no handicap

Handicap Engagement

  • Early-tenure no-handicap %

Member Stability

  • Early-tenure exposure %
  • Stable membership %
  • Stability-to-exposure ratio

Demographic Sustainability

  • Members aged 40–55
  • Average age

Gender Pipeline

  • Female members under 55
  • Female share of membership
  • Female average age
  • Female replacement ratio

Every indicator is shown against the annual baseline with a directional trend — so your board can see at a glance whether each measure is improving, holding or deteriorating since the full year analysis.

What you receive

An online report covering the health of your membership in full

Executive Summary

An overview of your club's structural position, the key findings from the analysis, and where the greatest opportunities lie.
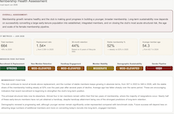
Executive Summary report page

01

Recruitment

How effectively your club is replacing members who leave — and whether your recruitment rate is keeping pace with attrition.
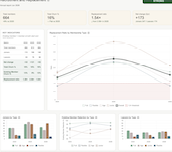
Recruitment report page

02

New Member Retention

How many new members stay beyond their first and second years — the period when the risk of leaving is highest.
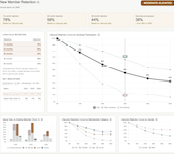
New Member Retention report page

03

Handicap Engagement

Whether new members are engaging with competitive golf — one of the strongest early indicators of long-term retention.
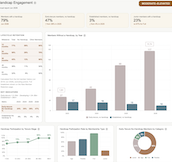
Handicap Engagement report page

04

Member Stability

The proportion of your membership that has been with the club for three or more years, and how that balance is shifting over time.
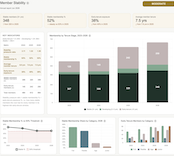
Member Stability report page

05

Demographics

The age profile of your membership and what it implies for long-term subscription income and the club's financial sustainability.
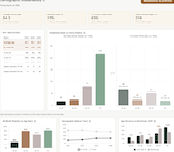
Demographics report page

06

Gender Pipeline

Whether female membership is growing, stable or in decline — and what the current trajectory implies for long-term membership sustainability.
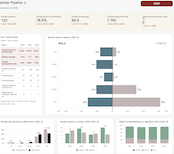
Gender Pipeline report page

Risk Analysis

Draws together findings across all six dimensions to identify the areas of greatest structural risk — ordered by severity and cross-referenced to the relevant analysis.
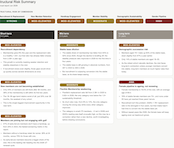
Risk Analysis report page

Signals Page

Upload fresh membership data regularly to track whether key indicators are moving in the right direction. Included with all Full Assessment licences.
Signals Page report page

Built on more than a decade of membership data analysis. Delivered as a secure online portal within a few days of data receipt, accessible to whoever you choose to share it with. Each section is navigable independently. Access is provided under an annual licence.
What it all means

The Risk Analysis is where six dimensions become one answer.

Every dimension in this report identifies a piece of the picture. The Risk Analysis is where they come together — a single page that ranks structural risk by how soon it matters: short term (0–2 years), mid term (2–5 years) and long term (5+ years).

Each risk is named, sized and explained, not just flagged. The page closes with Priority Actions — the specific steps most likely to protect income that's currently at risk and build value that isn't yet being captured.

Ongoing membership tracking

The Signals Page keeps the baseline alive.

Clubs make decisions throughout the year — a new joining process, a mentoring scheme, a recruitment campaign. The Signals Page lets club management see whether those decisions are having the intended effect.

Upload fresh membership data regularly and BirdieIQ tracks changes in recruitment, onboarding, retention and membership structure — giving club management an updated picture at every meeting of whether the membership is getting stronger or whether new risks are emerging.

Signals Page

Representative report for illustration — not real club data.

From the report

New Member Retention

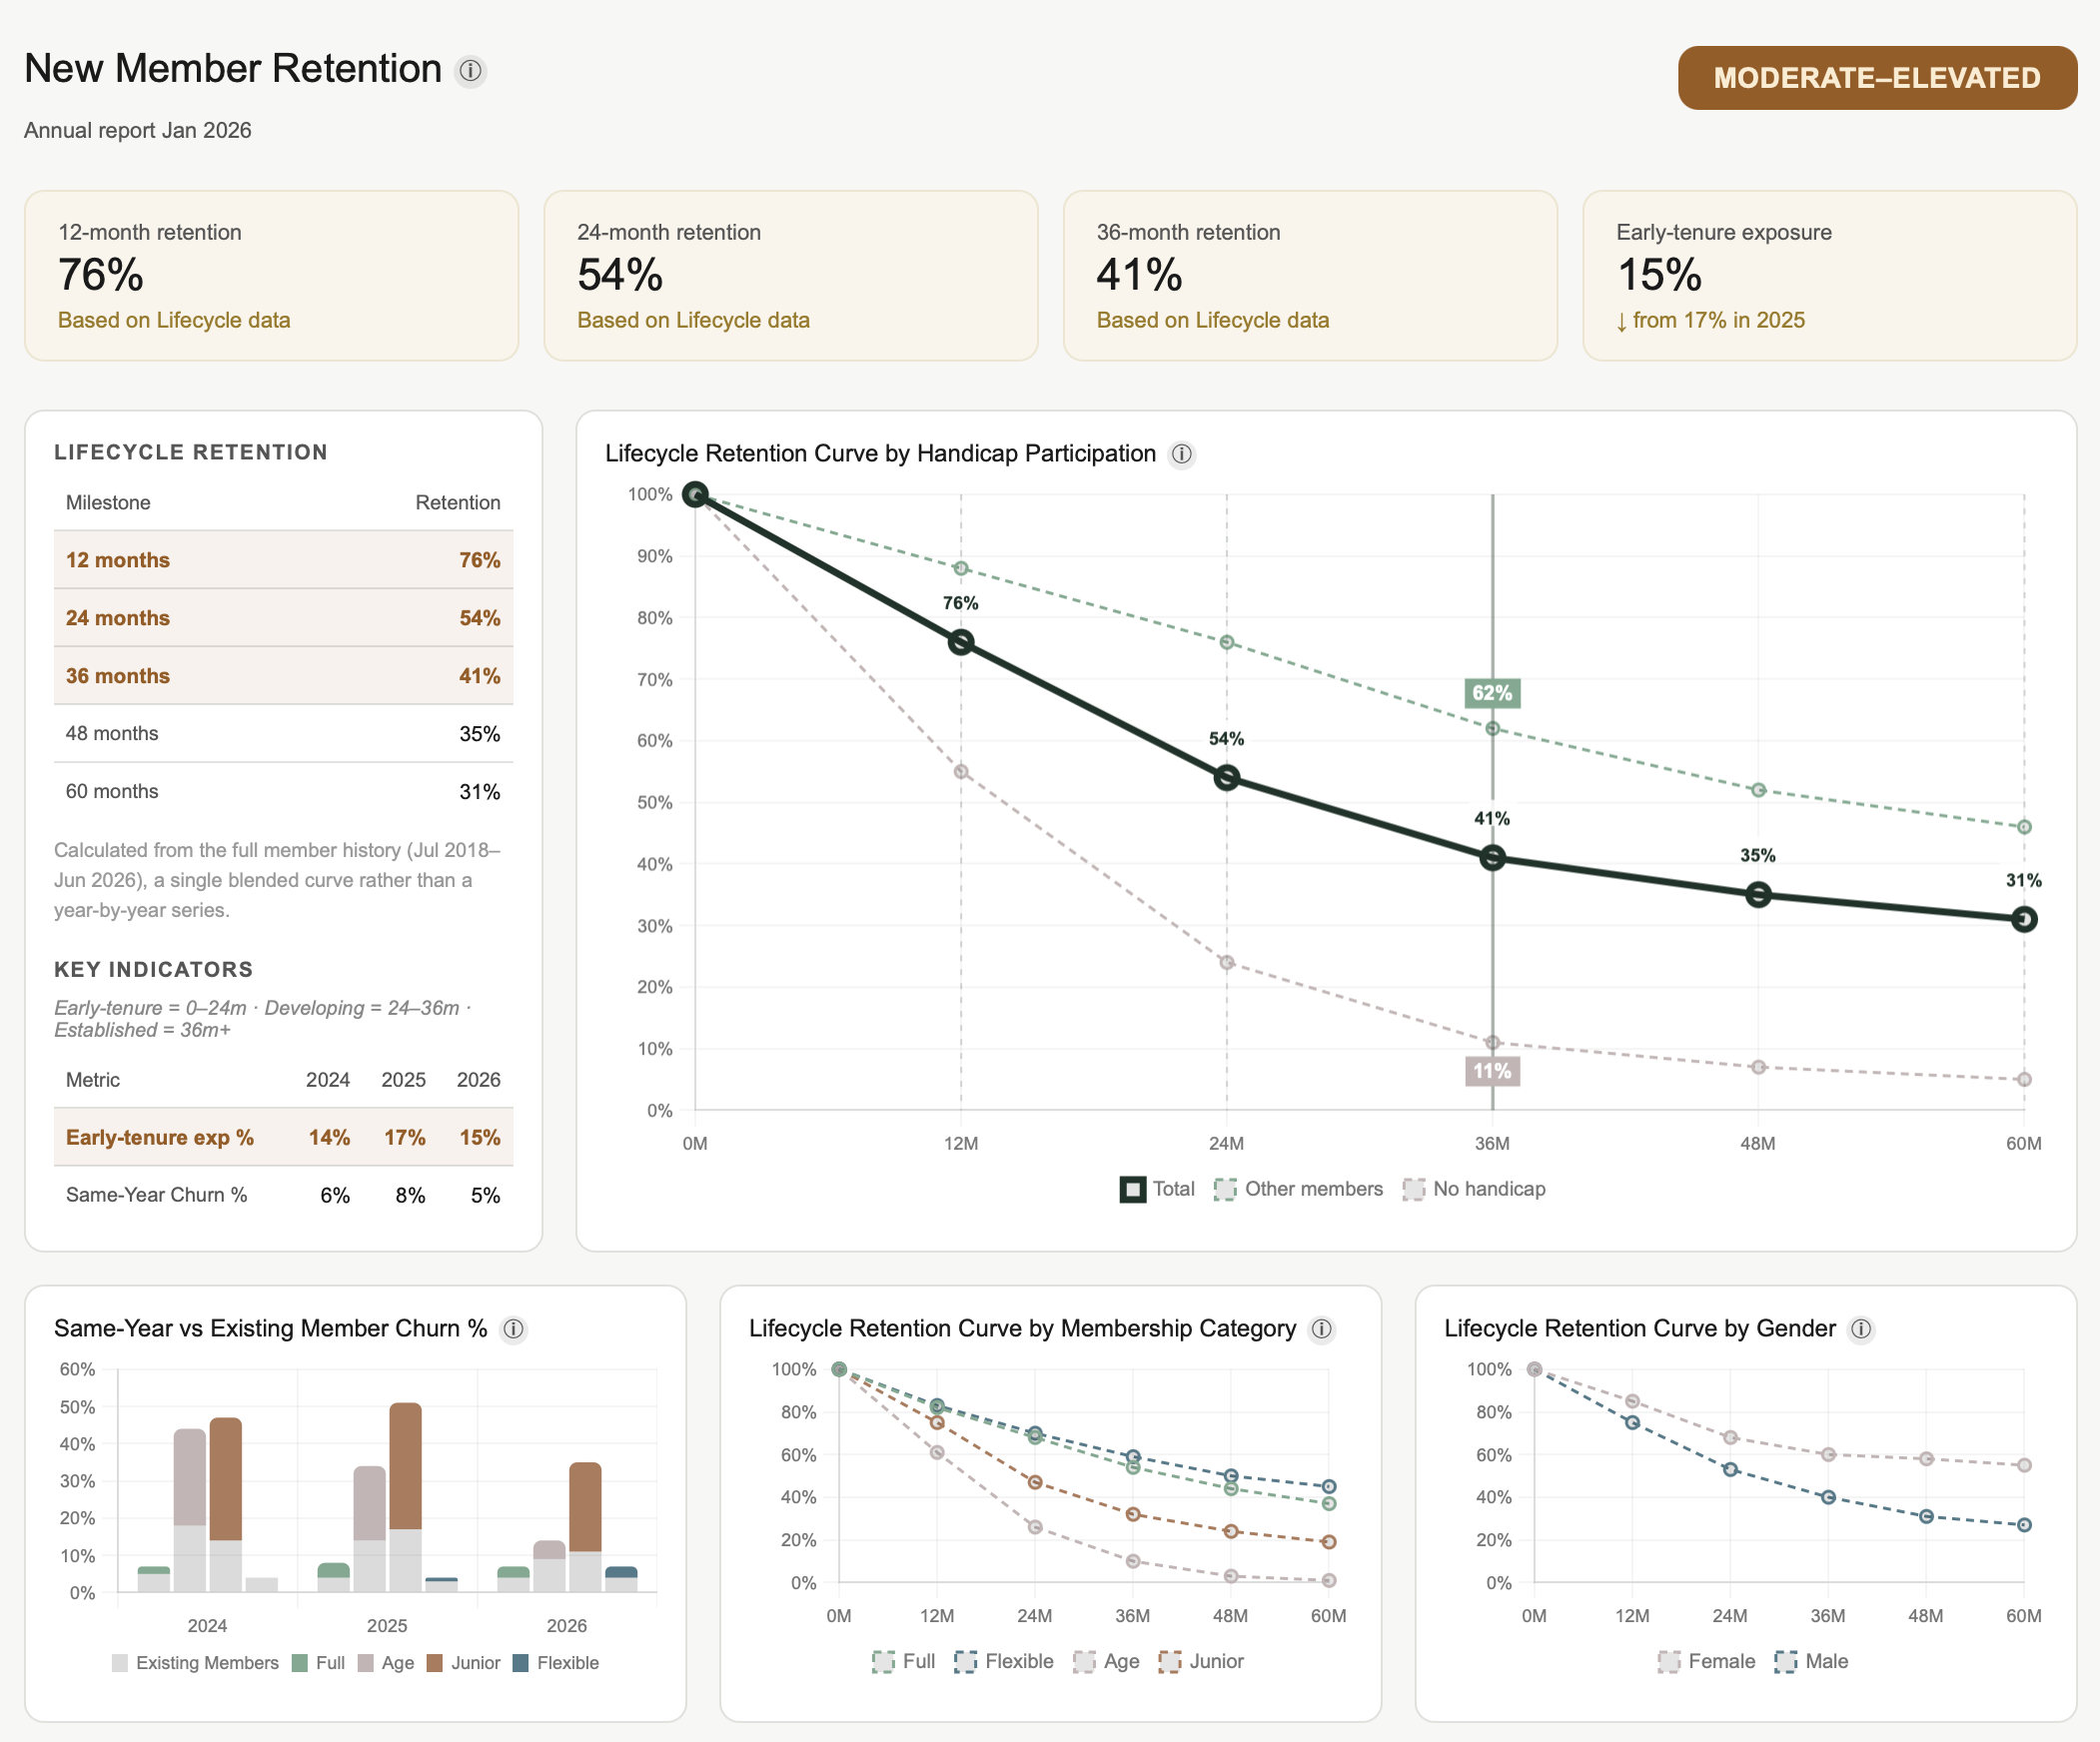
A representative extract from New Member Retention, one of the six dimensions in the full report, built to the same layout and structure as a live BirdieIQ report. The chart shows retention at 12, 24, 36, 48 and 60 months — identifying where in the membership journey attrition is highest.

Sample — New Member Retention
Sample BirdieIQ Report — New Member Retention

Representative report for illustration — not real club data.

Getting started

What we need from you

Most clubs can provide the necessary data directly from their existing membership management system.

Six data fields required
✓  Join dates
✓  Leave dates
✓  Membership category
✓  Gender
✓  Handicap status
✓  Month and year of birth
No member names or personal identifiers are required. Date of birth is provided as month and year only, with no name or contact details attached. All data is handled in full compliance with GDPR and treated with strict confidentiality.

A Data Processing Agreement is provided as standard.

Find out where your membership stands

For a club with 500 members at an average £1,000 subscription, reducing avoidable early-tenure churn by even a handful of members a year protects real recurring income — and the years of secondary spend that come with every member who stays. Get in touch and we'll explain what a Full Assessment would involve for your club.

Request a Full Assessment

We'll have a brief conversation about your club, confirm the data requirements and send you a data submission template. Most clubs have their report within a week of submitting their data.

Or email info@birdieiq.co.uk directly.

Want to start for free? The Health Check gives you an Executive Summary and one analytical dimension — at no cost.